Weekly Technical View
Weekly View on NIFTY, BANK NIFTY, USD/INR, GOLD, CRYPTO
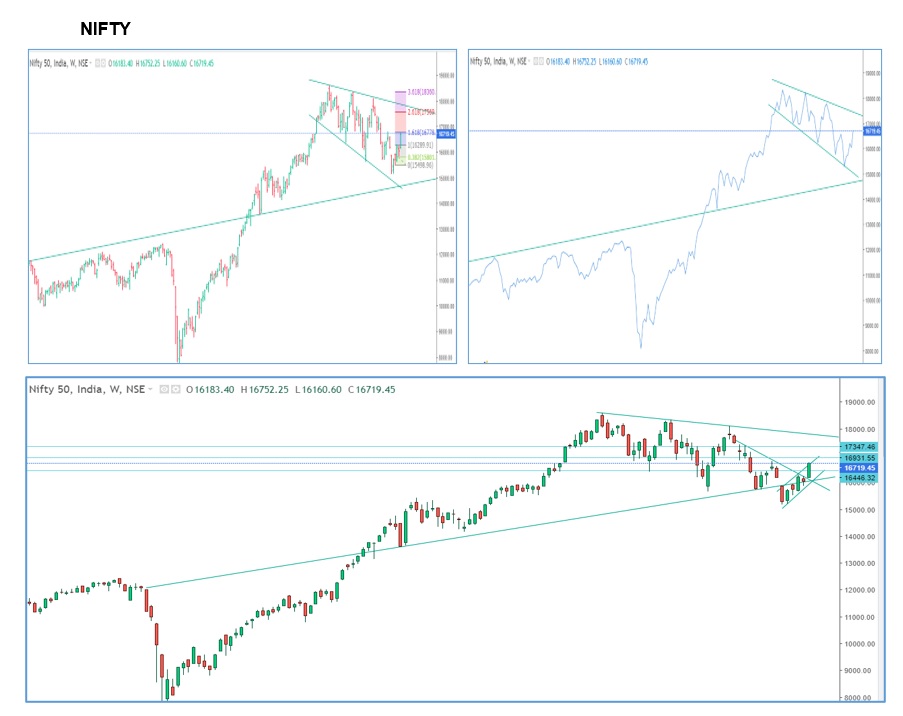
NIFTY :-
The past week saw a good upswing on break of the downward sloping trend line around 16200 as expected. While we could see large selling interest between 16400-500 range, the Index kept the momentum and scaled a peak of 16750. The market outlook appears to have changed to positive.
A few observations from the weekly charts are:
- Weekly charts suggest that
- Two key triggers are
- After playing around the long term trend line drawn from 24th Feb 20 for two weeks this time stayed fully above this trend line.
- Break above 16180-220 which was a cross-over of the downward sloping trend resistance
- Cross-over of the Mid BB on weekly at 16580
- As expected more short covering likely to happened above 16330-400 range and with the momentum the Index could reach a very strong resistance zone from where the deeper correction happened.
- As noted in the past, above 16330 is clearly a new trend emerging
- Oscillators are showing positive signal on both Daily and weekly charts
- All is well? and Are we back in to another Bull run?
- We are seeing a switch between extreme pessimism to greed and high expectations. It remains to be seen whether the higher levels will sustain.
- Expected scenarios for the ensuing week
- A few interesting observations from the weekly chart
- The range between 16280 to 16640 has seen sharp moves with gaps on either side on earlier two occasions.as well
- For now, 16330-440 range seem to be creating another base.
- Daily close below 15450 could make the Index drift lower
- FIIs have turned net buyers for a couple of sessions. Is it a bait?
- Do not see the Index run past 17030
- Expect a consolidation between 16440-17030. Any close outside this range requires re-assessment of risk
- For the past 6 weeks we have seen alternate weeks of strong bullish candles followed by a small bearish or inside candle. All likely that we may see a similar move in the coming week. Possibly a healthy consolidation.
- A few interesting observations from the weekly chart
- Monthly chart shows favorable signs of pullback and the oscillators are turning which requires confirmation
- While all set targets are achieved, there is still some steam left in this move. However, the major resistances at 16780-810 range being the first and then 16930 and the next at 17030. All these levels are expected to be tuff nuts to crack expect for the option open interest exposures deciding the direction. We see a huge open Interest for 17K call. A few of the majors still trading at lower levels in spite of this sharp move.
- The logic being that after making a near tweezer bottom around 15200 during mid-June, the price Fib projection based on the price points coincide with the target of 16780-830 range providing allowance for the noise. This range is again the major break down point for the down move.
- While the next target is clearly 17400 and then 17800 as per the longer term trend, how things would span-out depend on the monthly close and the way Index consolidates
- The index just covers the June loss if closes above 16780
- The last week July is going to decide the fate of future course of direction of the market. Downside risk still exists till we see a Monthly close above 16800.
- While all set targets are achieved, there is still some steam left in this move. However, the major resistances at 16780-810 range being the first and then 16930 and the next at 17030. All these levels are expected to be tuff nuts to crack expect for the option open interest exposures deciding the direction. We see a huge open Interest for 17K call. A few of the majors still trading at lower levels in spite of this sharp move.
- The risk perceptions appear to be changing with easing of crude prices.
- Market may be cautious due to concerns on Inflation or possible recession and the FED Rate decision towards the end of this month
- Two key triggers are
Bank Nifty:
As expected the Bank Nifty moved sharply to 36200 and then to 36800 on break of 35500. The momentum continues to favor higher levels. Could stay in the range of 35k & 37.5k. A close outside this range requires re-assessment. There could be major barrier around 37400-600 range. Excluding a couple of aberrations, the trend channel is intact. The Bank Nifty may hit the wall around 37400-600 range and retreat.
USDINR
79.70 continues to be elusive and the pair is no mood to return to the break-out level. Friday’s close gives some hope. Well ahead of the top of the long term trend line and the final line of control the pair appears to have made a top at 80.30. This region could hold for some more time if no fresh risk emerges. The oscillators in the daily charts suggest a pull back towards 79.60 and the 79.40 in the near term. A daily close below 79.60 could be a breather for the markets to see 79.20. Any dip is likely to be bought. It is also possible that we may end up with a scenario where the Importers cover their exposure at higher levels and exporters still waiting for much higher levels. We may expect a consolidation between 79.20-80.30.
A close outside this range requires re-assessment of risk/direction and target.
Gold
There seems an interim support around 1680 and the precious metal bounced from there for a higher daily close after losing in many sessions. Till we see a close above 1740 we may see selling interest emerge. Now that we are almost close to Mar 21 lows. Monthly charts still show a bearish scenario. Appears that we are replicating 2013 type of down move. Do not see a quick turnaround of fortunes for the precious metal investments.
Crypto
With Dec 20 lows providing decent support for the past 4 weeks, we see some stability in the crypto assets. We may expect a 20% bounce with stops below last month lows. We may see strong action in the next couple of weeks. Selling pressure likely to exist on every spike. There are chances that we may see huge short covering in the coming sessions. While retail Investors might be shying away from this asset class for some more time, the big guys might attempt to take the prices higher.