Weekly Technical Report
Weekly Technical Report on NIFTY, BANK NIFTY, USD/INR, GOLD, CRYPTO
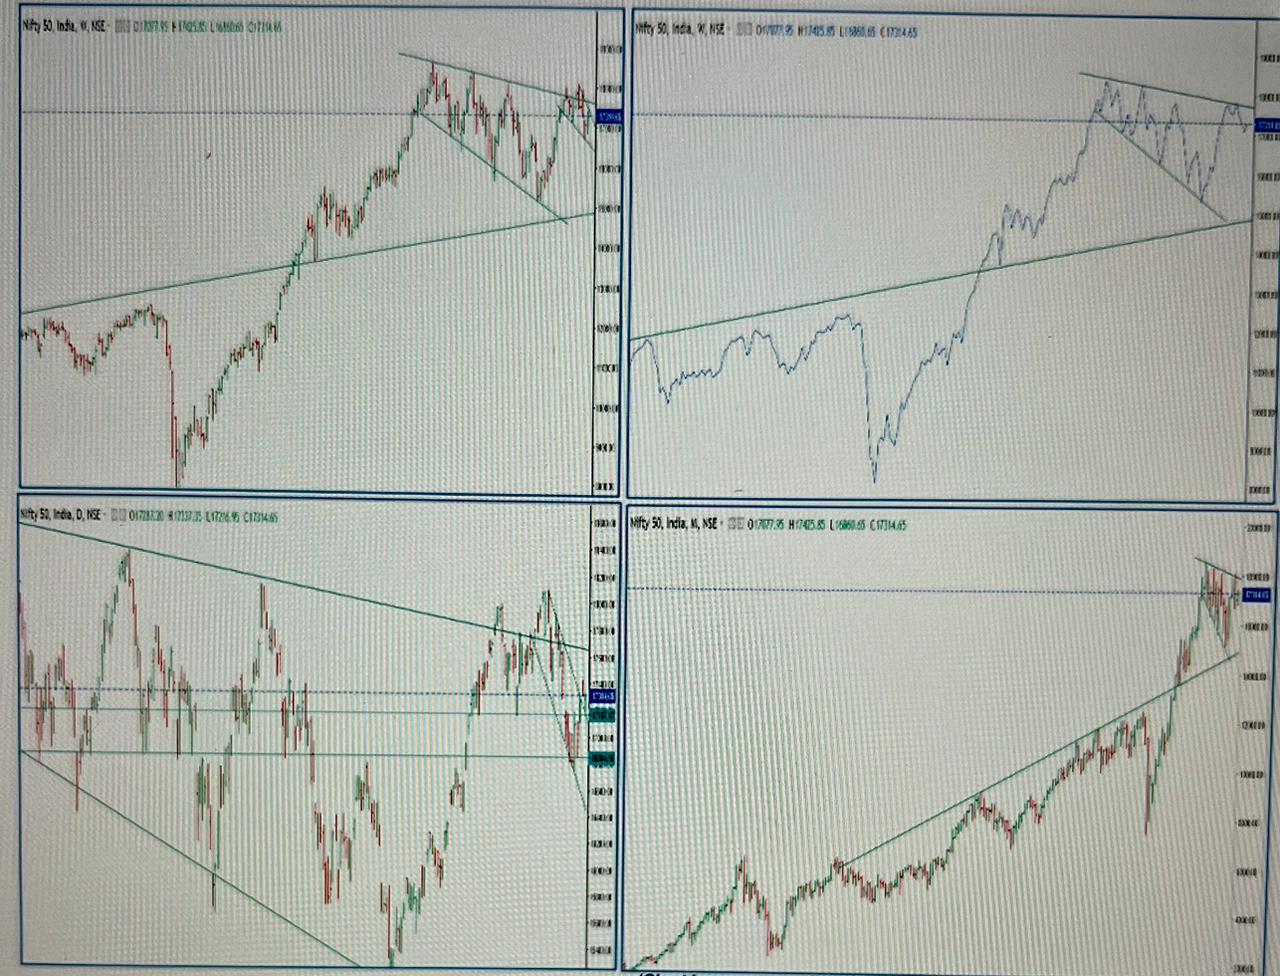
Past week’s saw a battle between Bears & Bulls to retain their territory. The Index safely formed a positive candle thus making 16850 a crucial support zone. We saw a sharper move cutting across key resistances at 17030, 17200 and went on to hit a high of 16425. Though there were concerns during the beginning of the week that the Index may drift lower due to the developments in the currencies and commodities it stayed afloat to post a decent gain over the previous week.
A few observations from the weekly charts are:
- Weekly charts suggest that
- As observed the index could move higher and make further gains due to a sharper move coupled with a close above 17200
- Oscillators are showing mixed signal
- Option exposure would continue to drive the market
- A few interesting observations from the weekly chart
- The previous candle being a look-like hammer followed by a positive candle gives hope for a potential target of 18110.This gets negated if we see a breach and a close below 16740.
- Daily charts show a declining trend line resistance at 17370 and supports at 17070 16940 & at 16750.
- Going forward 17500 itself would be a tuff barrier
- Expected scenarios for the ensuing week
- Though closed higher, the Index is expected to open lower and longer time spent below 17100 would open further downside till 16940.
- For the ensuing week the index could face multiple resistances at 17220, 17370. 17450 & 17600
- Daily close above 17450 required for further gains
- While the trend seems to have reversed, the support at 16800 & 17600 are crucial
- As expected the Index stayed in the congestion zone and likely to continue the same consolidation range of 16700 and 17400. Breach and daily close outside this range requires re-evaluation of risk, direction and target
- As being highlighted in the past weekly reports the gaps listed below are open and are vulnerable. Remains to be seen how many of these gets filled in this down move.
- 16360-16560
- 16650-16770
- 16920-17070 Got filled
- 17160-17240 Got filled
- 17190-17290 Newly created Got filled
- The oscillators in the Monthly chart shows divergence
- October is a crucial month for the Index to scale back or give-up chances of 18k+
- Additional observations
- We are in an uncertain territory.
- Q2 results are due and next couple of weeks are crucial for clear direction. The recent trend is that a couple of sessions alter the direction and sentiments
- We may see a consolidation in the congestion zone-17360-17040-16840-16550
- It is observed that the Index has spent considerable time between 16850 and 17400 range before breaking either side
- A close below 16600 is of high risk as the zone between 16600 & 15600 is a slippery wicket and could see swift moves
- Markets are disconnected. Sudden jump in crude prices will have major impact fighting inflation
- The weekend developments in the geo-political scenario would actually dampen the sentiments and suggests that there could be extended pain & uncertainties for the markets.
- BANK NIFTY
Bank Nifty reversed the down move and made a weekly bullish candle. Though the weekly is a positive one, there could be selling pressure till we see a daily close above 39700. Once the crucial 39700 is breached on a closing basis we can see q sharp move towards 40600. A decent recovery in Bank Nifty can help main index NIFTY to hold to 17k levels. Next couple of weeks are crucial for further direction. We can assume that the trend still remains positive till we see a close below the trend line support at 37100. It appears that the Bank Nifty is likely to continue in the range of 37700-39700 for another week before finally deciding the direction. A daily close outside the range requires re-evaluation. Only a Daily close above 40.5K can provide the required momentum for scaling the earlier peak.
USD/INR
The pair continues to drift higher and there are no indications of a possible reversal The risk of huge break-out has been highlighted in every blog since first week of May 22. Now 80s would appear to be a boon. The upside is still wide open with possible intermediary target at 83.30. Daily close above 83.00 opens the door for next round of sharper move towards 84.60. Expected range 80.90-84.60. A close outside this range requires re-assessment of risk/direction and target.
A few more observations:
In the Aug last weekly blog (29 Aug-03 Sep), the trend analysis of the 2013, 2018 & 2022 were discussed and the concerns of USDINR moving higher has been highlighted.
Where we are heading to?
One of the possibilities…we will still be inside the long term trend line till we do not step away from 83.00 levels. Practically that does not seem to hold good with the momentum still playing for a lofty shot. What impact on other segments of the market? Tuff times ahead.
Another view is that Fib projections point to 86.90 levels. What might trigger such grave situation? Panic buying and external factors?
An odd situation from the past … Aug 2013 saw a move from 60.20 to 68.70
We can only hope and pray that such move does not happen now.
Another interesting observation from the 2018 move is that it started in Feb and seen the peak in Oct. Will the same trend be happening now and we start seeing reversal post Oct 22? How many businesses will survive depends on the level to which it spikes before cooling off and the level of exposure un-hedged.
Gold
The precious metal seems to find some support around 1670 and the oscillators are turning positive. As expected we saw a spike till 1730 one breach of 1690. The previous weekly candle appears like a hammer and with confirmation through a positive candle and the target is expected to be1780. Next couple of weeks are crucial for the metal to regain some of the lost luster. Upcoming festive season and changing landscape of Geo-political risk scenarios could be aiding a recovery.
Crypto
For more than a quarter the Crypto assets have moved in a narrow range with sharp moves on either side. Seem to find buying interest around the Nov 20 opening levels. Presently the crypto assets are at a crucial price point. A 10% slide from here would see huge stops which would pull down the prices by another 20%. The assets are likely to sold-off on every spike higher. Next few weeks are decisive for the crypto assets to withstand the assault. Technically it appears so. This can only be negated if it gains 30% with a sharp move. Most likely scenario waiting to happen is the final holy dip before a recovery.
Crude
After four months of cooling the crude prices have shown its ugly face. The final support at 74 held and now it would be difficult to see it again for some time. As expected a spike towards 85 happened and stops triggered a spike to 93 levels. We are back again to another consolidation zone of 85-104. Inflation rhetoric will start again. Geo-political risks adding to the volatility and difficult times. Only a coordinated approach can help resolving conflicts and the fight against the Inflation and averting recession.