Weekly Technical Report
Weekly Technical View on NIFTY, USD/INR, GOLD, OIL, CRYPTO
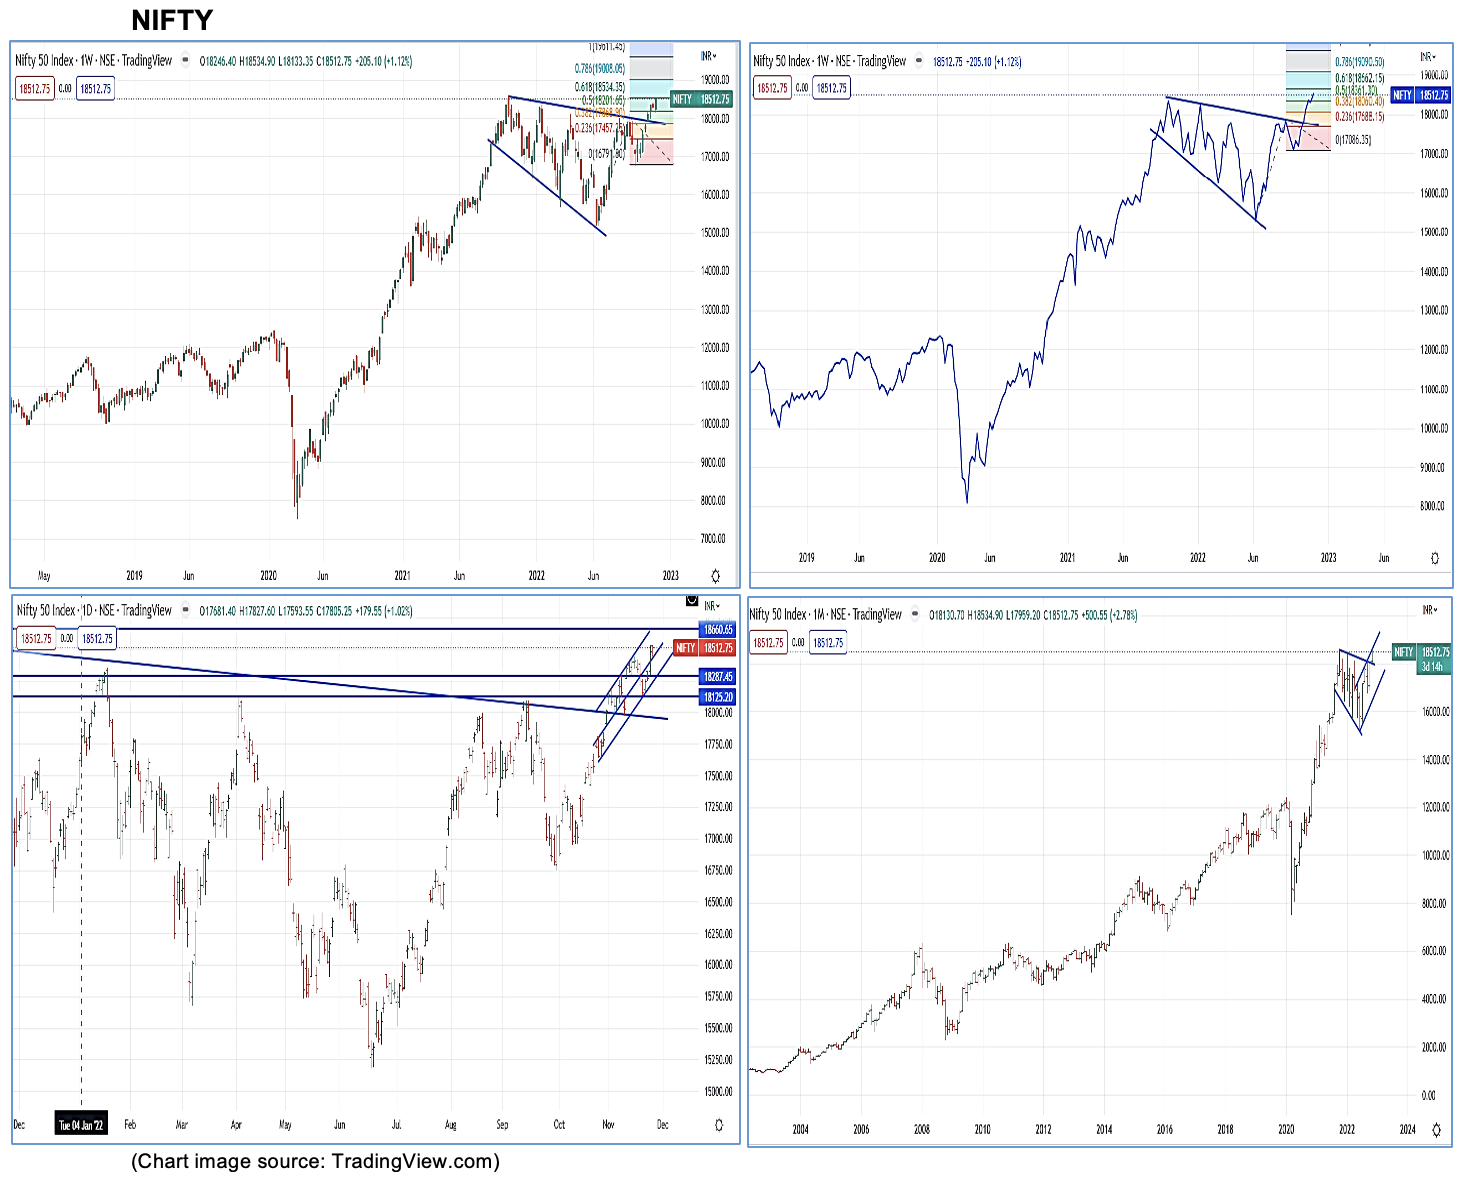
NIFTY :- During first three days of the week the index was looking vulnerable and held captive below 18360. The final hour of option expiry saw a spectacular move to conquer 18500 zone. It actually attempted the downside support. A move after consolidation is a healthy sign. The NIFTY index is showing similar type of move as it happened in Bank Nifty when attempting 42k.
A few observations from the weekly charts are:
- Weekly charts suggest that
- The index moved around 400 points viz. between 18133 and 18534
- With the strong move the oscillators are showing positive bias
- Option OI is expected to drive the market direction
- Additional observations from the weekly chart
- The Index made higher highs and lower lows and it ended up with a bullish candle
- Index seem to have generated higher momentum to post a new ATH
- Expected scenarios for the ensuing week
- Though closed at 18512, the Index is expected to open lower
- Break below the trend line support at 18320 would see the index drift lower
- For the ensuing week, the index may find supports at 18370, 18240, 18130 and the index could face resistances at18560. 18670
- A daily close above 18670 would be seen as strongly biased towards a big leap forward
- The oscillators in the Monthly chart are turning positive and requires stronger momentum
- Additional interesting observations
- As expected the projected target of 18530 has been achieved and a move towards 18700 are possible based on Fib projection of Monthly charts
- FIIs did try a sell-off with volumes on 2 trading sessions. However, finally both FIIs and DIIs seem to be net positive
- Two possible scenarios
- Expected rage of 18240-18530 or 18360-18666
- Any breach on a daily closing basis below 18360 would trigger stops and we may expect the move extending to 18240. Any close outside the range of 18240-18670 requires re-assessment of risk
- US Markets
- DOW saw decent gains
- The market seems to have priced in additional 50-75 BP hike and not seem to be bothered about inflation or a possible recession
- Job cuts by Tech giants are a cause of concern
- As observed in the previous blog DOW has successfully cleared 34K and on its way to 35k based on the Inv H&S target
- US Tech stocks which have been hammered for nearly a year is likely to lead the pack
- Final Note
- We see an Inv H&S pattern on weekly with Head at 15800 & base at 17600 suggest a target of 19k?
- The angle of inclination in the line chart suggest potential for achieving a new ATH as first goal post.
- While the cross-over of 18530 would be treated as a move towards final target of 19k, various indicators suggest the Index may post ATH of 18670 and face tuff resistance around that peak. A daily close above 18670 would trigger bigger stops and would quickly move towards 18800
- For now, the market seems to ignore Recession worries
- Just a couple of sessions/weeks make markets to change perceptions
- Last week witnessed saw a sharp move due to Option expiry
- Next two three sessions are crucial as there could be a fight for a favourable monthly closing
- If for any reason we see a closing below 18200 then there are chances that we may see a course correction before reemerging with renewed vigor for next target of 19k
- There are no signs of a possible reversal yet
- Time to tighten the seat belts
- An interesting week ahead
BANK NIFTY :- The Bank Nifty managed to post a new ATH. Past week saw a narrow range 546 points of consolidation while some of the components of Bank Nifty managed considerable gains. We see the Index move in a channel with top at 43800 and lower end at 41900. Till we see a close below 41800 the trend is considered as bullish. The Bank Nifty has achieved the first Fib projection of 43340 and the next target is 44960. When and how is the question. Will there be a pullback prior to this? However, there may be hurdles at current levels and then at 43600-43800 range. This week is crucial to see whether the Bank Nifty breaks the barrier and makes another new high or breaks down. We can assume that the trend still remains positive till we see a close below the trend line support at 41900. It appears that the Bank Nifty is likely to continue in a wider range of 41900-43800 with 42700 as pivot and a breach and close above or below could see the next range of 1000 points. For now, Bank Nifty continues to be in a trading range. A daily close outside the broader range indicated above would require re-evaluation. It is worth noting that for any pull back first requirement would e a daily close below 42700.
USD / INR :- After a sharp recovery in the previous week the pair was traded in a narrow range of 81.44-81.93 during last week. However, the Monthly candle confirms the trend reversal. We can safely assume that the top at 83.10-83.30 is expected to hold for the current month and possibly till the year end. We are witnessing demand driven by unhedged exposure getting covered. The ultimate projection for the down move is 79.20 which might take a couple of weeks. Due to various factors the currency is expected to consolidate between 80.70 & 82.70. A close outside this range requires re-assessment of risk/direction and target.
A few more observations:
- In the previous blogs the comparative analysis of 2018 & current scenario was discussed and suggested a possible correction in Nov 22 which is in progress. We saw nearly a 4 big figure correction in 2018. If the same were to repeat, we may see 79.20 soon.
- The long term trend line till at 83.10-83.30 levels holds for now and we are likely to see a consolidation between 79-82
- The DXY breaking the strong 106 is a sign of top in place for USD index. We may not see a runaway in DXY. the 105-106 range is yet another crucial price point and breach would see further fall to 102.
- The full impact of the correction has not yet been seen in USDINR currency pair, the fall in DXY might have given a sigh of relief for many Central Banks
- We do not see an immediate threat of crossing 83
- The raising upward channel indicate the broader range of 80.10-82.70
- The increased volatility and wild swings likely to continue
Gold
The precious metal saw a consolidation in a narrow range between 1728 & 1761. The precious metal seems to be regaining the lost luster aided by the Crypto crash. Any reactive pullbacks towards 1710-1720 might see buying interest. A daily close above 1780 required for further gains. For now it appears like a consolidation between 1740-1840.
Crypto
We have been highlighting the risk of the Crypto assets getting thrashed once Nov 20 lows are breached. We had a huge Gap during the upswing in November 2020. As the Nov lows have been breached, we are in the process of filling the gap created between Nov & Dec 20. The worst does not seem to be over yet. We can expect more pains to follow. Though we may see sell-off on every spike. It is likely to be a long haul for recovery and for regaining investor confidence in this asset class.
Crude
The fall towards 75 levels is a cause of concern. The long term median line is 75. This would mean that we would be seeing 70 shortly. Technically, there seems a possibility of the Crude drifting to 50s if 70 gives-up. What does that imply? An advance notice for slowdown/recession. Either extremes are likely to hurt the economic activities and the outlook. Ideal scenario would be that the crude finds its sweet spot between 72 & 82. We may see sudden spikes and subsequent cooling-off within this range. There are many uncertainties on the demand and winter worries. Sounds safe for now as long as we see the crude move in this range of 70-90.